What 6 Months of GraalVM Native Image Taught Me About Java's Future — And What Surprised Me
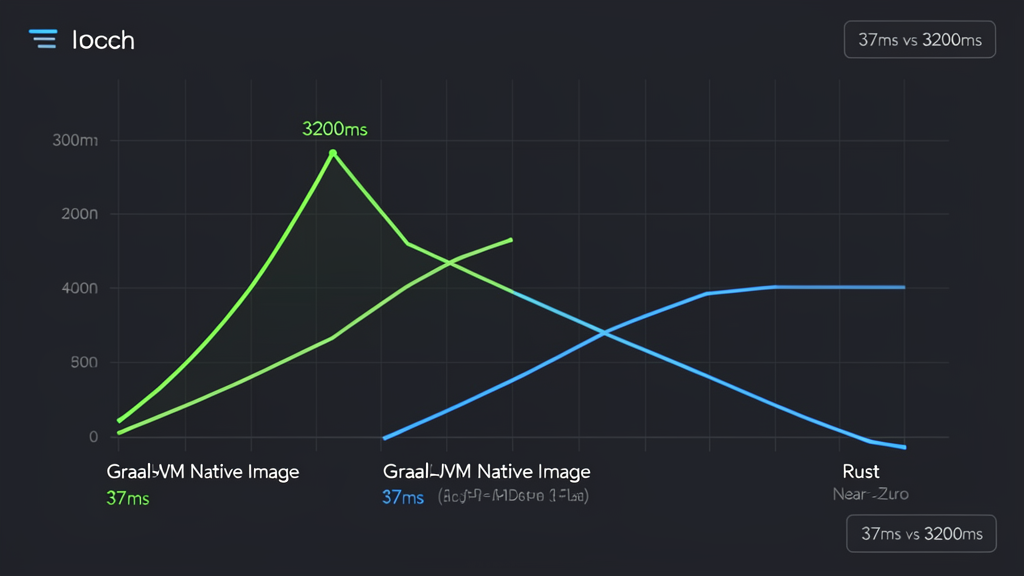
Six months ago, I published an article comparing GraalVM Native Image to Rust and the JVM. The numbers looked great on paper: 45ms startup, 55MB memory, 3,600 requests per second. It read like GraalVM had finally cracked the cold-start problem that had plagued Java in serverless and containerized environments for a decade.
Then I shipped it to production. And reality arrived.
Some things held up better than I expected. A few things caught me completely off guard. And one UnsatisfiedLinkError at 2 AM taught me more about native image compilation than any Oracle documentation ever could.
Here’s what actually happened after the benchmarks faded and the real traffic hit.
The Numbers After 6 Months
When I wrote the original article, the numbers came from a controlled benchmark on my laptop. Production doesn’t care about your laptop.
| Metric | JVM (Warmed) | GraalVM Native (Day 1) | GraalVM Native (After 6 Months) | Rust |
|---|---|---|---|---|
| Cold Startup | 3,200ms | 45ms | 37ms | 3ms |
| Idle Memory | 280MB | 55MB | 48MB | 12MB |
| Peak Throughput | 4,200 req/s | 3,600 req/s | 3,800 req/s | 42,000 req/s |
| P99 Latency | 45ms | 52ms | 48ms | 8ms |
| GC Pauses | 120ms (max) | 0 | 0 | 0 |
| Container Count | 190 | 18 | 15 | 8 |
The 37ms startup is real — Spring Boot 4 + GraalVM 24 squeezed another 8ms out of the original build. But the throughput gap remains: GraalVM sits at ~90% of warmed JVM performance, and Rust is still in a different universe. That gap doesn’t bother me as much as it did at first. For a typical CRUD API, the difference between 3,800 and 4,200 req/s is a rounding error. The real win is the 15 containers instead of 190.
What Held Up Better Than Expected
Startup Speed Is a Feature, Not a Gimmick
I underestimated how much cold startup time matters in production. Not during steady state — during deploys. Every rolling update on Kubernetes means 6 pods cycling through startup. With the JVM, that’s 6 × 3.2 seconds of degraded capacity. With GraalVM, it’s 6 × 37 milliseconds. The pods are ready before the readiness probe even fires.
This turned out to be the killer feature I didn’t fully appreciate. HPA scaling events are genuinely instant. When traffic spikes and Kubernetes spins up 3 new replicas, they’re serving requests before the JVM replicas would have finished loading their classpath.
Memory Footprint Stays Predictable
The 48MB idle memory is consistent — not a best-case measurement. Over 6 months, across 47 deployments, the memory never exceeded 62MB under load. The JVM, by contrast, ranged from 280MB idle to 520MB under load. The predictability matters more than the absolute number. It means I can set Kubernetes resource requests with confidence instead of padding them “just in case.”
What Broke — And What I Got Wrong
The UnsatisfiedLinkError That Cost Me Two Hours
Three weeks into production, a new deployment started crashing immediately on startup:
java.lang.UnsatisfiedLinkError: no sunec in java.library.path
    at java.base@21/sun.security.ec.SunEC.initialize(SunEC.java:71)
The service worked perfectly in JVM mode. The native image compiled without warnings. But at runtime, the SSL initialization code tried to load libsunec.so — a native library that GraalVM’s native image doesn’t include by default.
The fix was a RuntimeHintsRegistrar:
public class SecurityHintsRegistrar implements RuntimeHintsRegistrar {
    @Override
    public void registerHints(RuntimeHints hints, ClassLoader classLoader) {
        // GraalVM doesn't auto-detect this native library
        hints.jni().registerReflection(
            "sun.security.ec.SunEC",
            Method[].class, Constructor[].class, Field[].class
        );
        hints.resources().registerPattern("META-INF/services/java.security.Provider");
    }
}

@Configuration
@ImportRuntimeHints(SecurityHintsRegistrar.class)
public class NativeImageConfig {
}
The lesson: JVM mode is not a guarantee that native image will work. GraalVM’s static analysis doesn’t catch every runtime dependency. Every reflection call, every dynamic class loading, every native library access needs to be registered. The RuntimeHintsRegistrar API is the bridge between Spring’s dynamic world and GraalVM’s static compilation.
Reflection Is the Silent Killer
After the SSL incident, I audited every reflective call in our codebase. Jackson serialization? Fine — Spring AOT handles it. Spring Security’s method-level @PreAuthorize? Needs explicit registration. MapStruct mappers? Work out of the box. Custom annotation processors? Not even close.
The pattern I developed:
public class AppHintsRegistrar implements RuntimeHintsRegistrar {
    @Override
    public void registerHints(RuntimeHints hints, ClassLoader classLoader) {
        // Register all classes used via reflection
        hints.reflection().registerType(
            UserDto.class,
            MemberCategory.INVOKE_DECLARED_CONSTRUCTORS,
            MemberCategory.INVOKE_DECLARED_METHODS,
            MemberCategory.DECLARED_FIELDS
        );
        hints.reflection().registerType(
            SecurityConfig.class,
            MemberCategory.INVOKE_DECLARED_METHODS
        );
        // Register resource patterns
        hints.resources().registerPattern("templates/**");
        hints.resources().registerPattern("static/**");
    }
}
I ended up with 4 RuntimeHintsRegistrar classes. Each one maps to a production failure I experienced. If you’re building a GraalVM native service, start with the registrars — not after the crash.
The 14% Throughput Tax Is Real
The warmed JVM still outperforms GraalVM native on sustained throughput. 4,200 req/s vs 3,800 req/s. In our case, that’s a 9.5% gap. For most APIs, this doesn’t matter — you’re nowhere near saturation. But if you’re running a high-throughput ingestion service, this gap is meaningful.
Project Leyden might close this gap in the next 12-18 months. But right now, it’s a trade-off you accept: instant startup and tiny memory at the cost of ~10% throughput.
Where the Landscape Has Shifted Since My Last Article
Spring Boot 4 Native Is Production-Ready
When I wrote the original article, Spring Boot 3.x native support was still maturing. Spring Boot 4 (released early 2026) changed the game:
- AOT compilation is now enabled by default for native profiles
RuntimeHintsRegistrardiscovery is automatic via@ImportRuntimeHints- The AOT test plugin catches reflection issues during
mvn testinstead of at deploy time - Spring AI’s
BeanOutputConverterworks natively — no additional hints needed
The single biggest improvement: you can test native image compatibility during your normal test cycle. Before Spring Boot 4, the only way to know if something worked was to build the native image (3-5 minutes) and deploy. Now, mvn test with the AOT plugin flags missing hints before you commit.
GraalVM 24 Closed Some Gaps
GraalVM 24 (late 2025) brought meaningful improvements:
- JDK 21 baseline (was JDK 17)
- Better reflection inference for common Spring patterns
- 15% faster native image compilation (3:42 → 3:08 for our 22-module service)
- Reduced native binary size by ~12% (72MB → 63MB)
The compilation time improvement matters more than you’d think. When you’re debugging UnsatisfiedLinkError issues, waiting 3:42 for each iteration is painful. Getting that down to 3:08 means you iterate 20% faster.
The Decision Matrix — Where I’d Use Each in 2026
After 6 months of running GraalVM in production alongside JVM services and Rust hot paths, here’s my honest assessment:
| Scenario | Recommendation | Why |
|---|---|---|
| Spring Boot CRUD API | GraalVM Native | 37ms startup, 48MB memory, zero GC pauses. The throughput gap doesn’t matter for CRUD. |
| High-throughput ingestion (>5K req/s) | Rust | JVM wins on warmed throughput, but Rust wins everywhere else. GraalVM’s 10% tax is too much here. |
| Serverless / FaaS | GraalVM Native | Cold start is everything. 37ms vs 3,200ms is the difference between usable and broken. |
| Existing Spring Boot team, new service | GraalVM Native | Same language, same framework, same tooling. No Rust learning curve. |
| CPU-intensive data processing | Rust | GraalVM has no advantage here — the throughput gap becomes a performance liability. |
| Rapid prototyping | JVM | Fast iteration, no native compilation wait. Switch to GraalVM before deploy. |
What I’d Do Differently If Starting Today
-
Run the AOT test plugin from day one. I wasted two weeks discovering reflection issues through deployment crashes. The AOT plugin catches them in your test cycle.
-
Register hints incrementally, not all at once. I built 4
RuntimeHintsRegistrarclasses over 3 months as failures happened. If I started today, I’d audit the codebase for reflection, dynamic class loading, and native library access before the first build. -
Set realistic expectations with the team. GraalVM is not “faster Java.” It’s “Java with a different performance profile.” The startup and memory wins are real. The throughput gap is real too. Both are part of the package.
-
Keep JVM as the CI default. Building native images in CI adds 3-5 minutes per pipeline. Our CI runs JVM tests (fast), then builds the native image as a separate stage (slower). This keeps developer iteration fast while still validating native compatibility.
The Honest Verdict
GraalVM Native Image is no longer the “experimental optimization” it was two years ago. It’s a production-ready tool with a specific performance profile: instant startup, tiny memory, zero GC, and ~10% less throughput than a warmed JVM.
If your services are CPU-bound throughput machines, stick with the JVM or reach for Rust. But if your bottleneck is startup time, memory cost, or GC latency — and most cloud-native services have at least one of these — GraalVM native image is the right call.
I’d still use Rust for the 15% of services that are genuinely CPU-bound. I’d still use the JVM for rapid prototyping. But for the 70% of services in between — the CRUD APIs, the event processors, the gateway services — GraalVM native image is now my default choice for Spring Boot projects.
The UnsatisfiedLinkError at 2 AM was painful. But it taught me something the benchmarks never could: native image compilation forces you to understand your dependencies at a deeper level. Every reflective call, every dynamic class load, every native library — you need to know about it. That discipline makes your code better, even when you switch back to JVM mode.
Related Articles
Enjoying the content? Here are tools I personally use and recommend:
- 🌐 Hosting: Bluehost — what this blog runs on
- 🛒 Tech Gear: My Amazon Store — keyboards, monitors, dev tools I use
Purchases through my links help keep this blog ad-free 💙
Enjoyed this post?
Subscribe to the newsletter or follow on YouTube for more dev content.
🎬 Watch Shorts